

MTS Helpdesk
Question:
What is analytical method (or procedure) validation and what is involved in this type of validation study as per ICH Q2?
Answer:
A definition of validation from ISO 9000 is as follows: ‘confirmation, through the provision of objective evidence, that the requirements for a specific intended use or application have been fulfilled.’ In ICH Q2(R2), the guideline about validation of analytical procedures that is used in the pharmaceutical/biopharma industry, it states that: ‘The objective of validation of an analytical procedure is to demonstrate that the analytical procedure is suitable for the intended purpose.’ Therefore, the aim of a validation study is to generate evidence which provides the proof that the method works as intended. (Note: In this article, the terms ‘analytical method’ and ‘analytical procedure’ are used interchangeably.)
The implication of this aim is that the study should not be an investigation into whether the method works, this should already be established in the method development process, but rather the validation study should be designed from the viewpoint of generation of suitable evidence which proves that the method works. The experiments that provide this evidence are organised under analytical procedure performance characteristics (APPCs), which each address different aspects of the method performance. These performance characteristics are not just related to the validation stage of the method, they are associated with the method throughout its lifecycle, beginning in the development phase.
The APPCs defined in ICH Q2(R2) (and ICH Q14, Analytical Procedure Development) are as follows:
- Specificity/Selectivity,
- Range, which includes:
- Response and
- Lower range limits of Detection Limit and Quantitation Limit,
- Accuracy,
- Precision, and
- Robustness.
For a given analytical procedure, relevant APPCs are selected and suitable experiments are designed which provide the evidence that demonstrates that the method is capable. The results generated from these experiments are compared to predefined acceptance criteria to assess whether the method is suitable for the intended purpose. The selection of appropriate acceptance criteria depends on the nature of the method and ideally is defined as part of an ‘Analytical Target Profile’ (ATP), prior to development of the procedure (as described in ICH Q14, the guideline on analytical procedure development).
An overview of each APPC is described below, in each case beginning with the definition from ICH Q2(R2), or in the case of Robustness, from ICH Q14. For some method validation studies, there may be an overlap, and thus a single experiment may be used to evaluate more than one APPC.
Specificity/Selectivity
‘Specificity and selectivity are both terms to describe the extent to which other substances interfere with the determination of an analyte according to a given analytical procedure. Specificity is typically used to describe the ultimate state, measuring unequivocally a desired analyte. Selectivity is a relative term to describe the extent to which particular analytes in mixtures or matrices can be measured without interferences from other components with similar behaviour.’ (ICH Q2)
A specificity/selectivity study involves identifying the potential interferences from both the sample matrix and the method itself (e.g., reagents) that could affect the outcome of the method, and demonstrating that either they do not interfere at all, in which case the method is specific, or that any interference is insignificant in terms of the intended use of the method, in which case it is suitably selective. Adequate selectivity may be assessed by considering the accuracy requirements for the procedure.
Typically, the absence of interference is demonstrated by measuring samples containing potential interferences and others that do not. The nature of the method will determine what type of demonstration is possible. In the case of separative methods, a visual output such as a chromatogram or electropherogram may be used, but for a non-separative method a quantitation evaluation will be required.
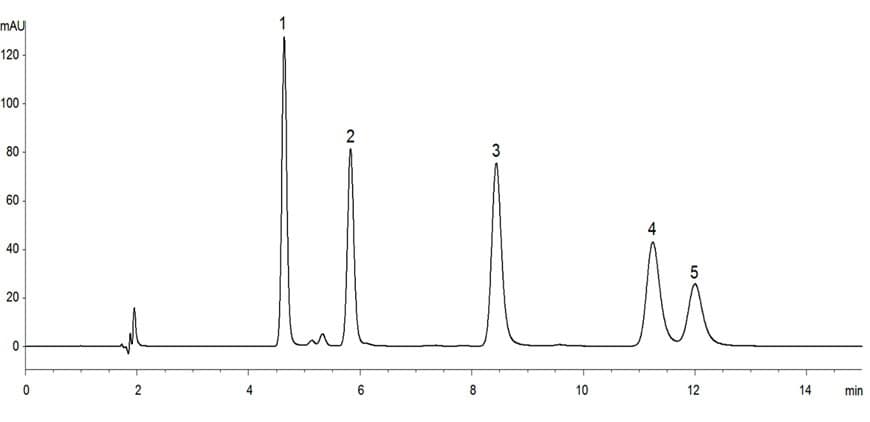
Figure 1. For separative methods such as chromatography, suitably labelled chromatograms may be presented as evidence of non-interference
For some methodologies, a technology inherent justification may be applicable, where the validation is a justification based on the inherent properties of how the procedure works and no experimental data is required. Examples provided in ICH Q2 are resolution of isotopes in mass spectrometry and chemical shifts in NMR spectroscopy.
Range
‘The range of an analytical procedure is the interval between the lowest and the highest results in which the analytical procedure has a suitable level of precision, accuracy and response.’ (ICH Q2)
For quantitative methods, it is necessary to define a range over which the analytical procedure will be used and ensure that validation data is available for the range. The data to support the range is typically derived from the experiments performed for precision, accuracy and response.
Response
‘The response of an analytical procedure is its ability (within a given range) to obtain a signal which is effectively related to the concentration (amount) or activity of analyte in the sample by some known mathematical function.’ (ICH Q2)
The part of the validation study relating to the response of the procedure will typically involve an assessment of the calibration approach. Commonly, calibration is based on a linear or non-linear relationship over the range of the method or could also be based on multivariate calibration. Demonstration of the suitability of the calibration approach may consist of testing any assumptions inherent in the calibration model. For example, linear relationships may be assessed by regression analysis and inspection of the plot of residuals for any non-random pattern, which could indicate a lack of fit that may be significant.
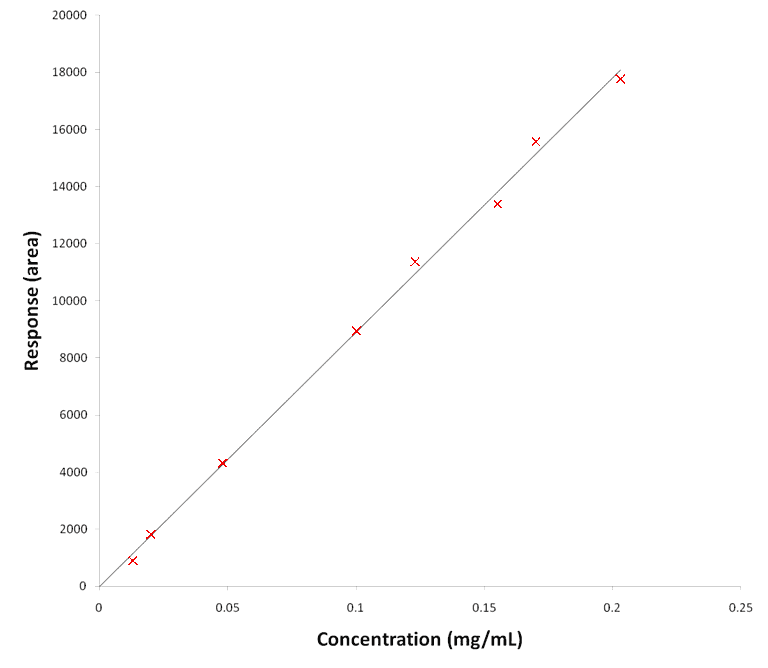
Figure 2. Example of a regression plot for a linear response
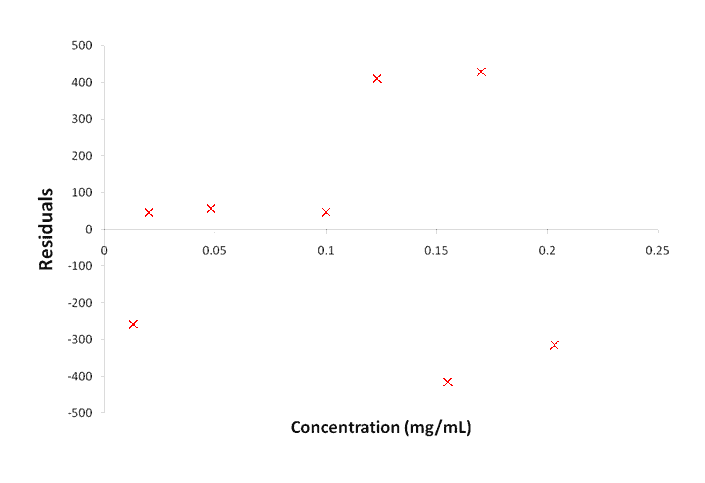
Figure 3. Example of a residuals plot for the evaluation of linearity
Detection Limit
‘The detection limit is the lowest amount of an analyte in a sample which can be detected but not necessarily quantitated as an exact value.’ (ICH Q2)
For the majority of methods that the ICH Q2 guideline is aimed at, i.e., test methods related to testing drug substance and drug products for release and stability, the detection limit is not relevant. For those methods where it is important, it will be fully explored in method development, and therefore the validation will consist of presenting suitable evidence. The usual options include: a visual evaluation, most commonly used for non-instrumental methods; a signal to noise ratio of 3:1, used for methods such as chromatography where baseline noise is present, or based on an estimation of the variability of the method, e.g., the standard deviation of blank measures.
Quantitation Limit
‘The quantitation limit is the lowest amount of analyte in a sample which can be quantitatively determined with suitable precision and accuracy. The quantitation limit is a parameter used for quantitative assays for low levels of compounds in sample matrices, and, particularly, is used for the determination of impurities and/or degradation products.’ (ICH Q2)
The evaluation of the quantitation limit may not be required for methods where the lowest point of the range is defined, and it has been proven to be accurate and precise. In situations where it is required, it is usually estimated using a similar approach as that described for the detection limit, i.e., visual evaluation, signal to noise, or a consideration of the method variability using a suitable standard deviation measurement. However, the quantitation limit needs to be confirmed to be accurate and precise so additional experiments are required which will typically overlap with the accuracy experiments performed at the low end of the range.
Accuracy
‘The accuracy of an analytical procedure expresses the closeness of agreement between the value which is accepted either as a conventional true value or as an accepted reference value and the value or set of values measured.’ (ICH Q2)
The aim of the accuracy study is to generate a value for the total systematic error in the procedure and compare this to an appropriate acceptance criterion so as to demonstrate that the method is suitably accurate. Either the recovery of the results generated by the method are expressed as a percentage of the amount known to be in the samples tested, or the difference between the calculated results and the known content (the bias) can be assessed. In ICH Q2(R2), it is directed that a suitable confidence interval is calculated and compared to the acceptance criterion. The confidence interval of the mean for replicate accuracy determinations is appropriate.
In ICH Q2, there is no distinction in terminology between individual replicates prepared as part of an accuracy study and the mean of these replicate determinations. In other validation guidelines outside of pharma/biophama, the ISO definitions may be used. A distinction is made between the individual determinations which are acted on by both random and systematic error, termed ‘accuracy’, and the mean of the determinations, which minimises the effect of the random error to leave an estimate of the total systematic error, which is termed ‘trueness’.
A common way to visualise accuracy is to imagine arrows shot at a target and how close they are to the centre of the target. Individual arrows are acted on by both random and systematic effects, and the mean position gives the best estimate of the total systematic error.

Figure 4. Accuracy visualised using arrows shot at a target
The experiments performed in an accuracy study are usually based on some type of spiking. An artificial sample which contains a known amount of the analyte of interest is the objective. Some test samples are more difficult to recreate in a representative way than others. For example, a solution for injection drug product may be fairly easy to recreate which has both a known concentration of the analyte(s) and is also very representative of the authentic sample material. However, a solid matrix, such as a tablet drug product is more difficult to recreate such that it is both of known concentration and truly representative of an authentic sample.
Precision
‘The precision of an analytical procedure expresses the closeness of agreement (degree of scatter) between a series of measurements obtained from multiple samplings of the same homogeneous sample under the prescribed conditions. Precision can be considered at three levels: repeatability, intermediate precision and reproducibility.
Repeatability expresses the precision under the same operating conditions over a short interval of time. Repeatability is also termed intra-assay precision.
Intermediate precision expresses intra-laboratory variations. Factors to be considered should include potential sources of variability, for example, different days, different environmental conditions, different analysts and different equipment.
Reproducibility expresses the precision between laboratories (e.g., inter-laboratory studies, usually applied to standardisation of methodology).
The precision of an analytical procedure is usually expressed as the variance, standard deviation or coefficient of variation of a series of measurements.’ (ICH Q2)
The aim of the precision study is to generate a value for the total random error in the procedure and compare this to an appropriate acceptance criterion so as to demonstrate that the method is suitably precise. In a pharma/biopharma setting, this is typically evaluated for repeatability and intermediate precision in a single laboratory validation study. Reproducibility may be evaluated in a co-validation situation as part of analytical method transfer but is not mandatory for the purposes of a regulatory submission.
The coefficient of variation (%CV), or relative standard deviation (%RSD), which are equivalent, is the most common statistic used for the acceptance criterion. In ICH Q2(R2), it is directed that a suitable confidence interval is calculated and compared to the acceptance criterion. The confidence interval of the coefficient of variation for replicate determinations is appropriate. Since the acceptance criterion takes the form of a maximum allowable value, it is the upper confidence limit which is of interest.
Ideally an authentic, homogeneous sample of test material is analysed multiple times since this is completely representative of the analytical procedure in routine use and will provide the best estimation of the total random error. On some occasions it may not be possible to obtain such a sample and in this case an artificial sample (as was described under accuracy) may be used.
Robustness
‘The robustness of an analytical procedure is a measure of its capacity to meet the expected performance criteria during normal use. Robustness is tested by deliberate variations of analytical procedure parameters.’ (ICH Q14)
In a robustness investigation the critical factors of the method are identified (these are the method parameters, e.g., pH, time, temperature, etc.) and in the case of continuous variables, the settings are varied to create a range which represents the potential variability that could happen during the routine execution of the method. In some cases, the factor may be categoric, such as the supplier and/or batch number of a consumable item, and in this case the investigator decides what values to include in the study.
Experiments are designed which enable the generation of suitable data and this is assessed to determine whether the factor effect is significant. The assessment often includes both practical relevance and statistical significance. If it is determined that there are no significant factor effects, then it may be concluded that the method is robust with respect to the factors that were investigated. If a significant factor effect is identified, then mitigation will be considered.
The amount of variation of the method parameters that is investigated (the factor levels) may depend on how the procedure has been developed. If a method parameter has a set point, then the potential variability relates to what could happen to the value of the set point in routine use, but if the method has been deliberately designed to include proven acceptable ranges (PARs) for the method parameters, then often the robustness study factor levels will be the extremes of the PAR. As per ICH Q14, a method operable design region (MODR) consists of combined ranges for two or more analytical procedure parameters within which the analytical procedure is shown to be fit for the intended purpose.
This APPC is evaluated during method development and as such is not usually considered as part of a validation study. However, in any discussion of APPCs, it would be remiss to omit it. Additionally, in the situation where an MODR has been developed, and the intention is to gain regulatory approval such that post-approval changes do not require regulatory notification, then validation data is required and this will most likely be derived from a robustness style study.
Planning a Validation Study
For a submission to a regulatory authority for the purposes of obtaining a marketing authorisation, all of the relevant APPCs indicated in ICH Q2 are evaluated. In other circumstances, a risk-based approach to validation may be implemented, e.g., for methods in early phases of development that are used to release materials for clinical trials.
The design of a validation study will be documented in a protocol. This will detail the APPCs that have been identified as being relevant, together with the experimental information, and the acceptance criteria that will be applied. The outcome of the study will be detailed in a validation report which is a useful resource to refer to throughout the lifecycle of the analytical procedure.
References
ISO 9000 :2015 Quality management systems – Fundamentals and vocabulary (3.8.13)
ICH Q2(R2) Validation of Analytical Procedures
ICH Q14 Analytical Procedure Development
Submit a Question to the MTS Helpdesk
Do you have a question for our expert relating to the topic of analytical chemistry? Use our enquiry form to send it to us.
Related content from our Resources Library
Services related to this content that we offer
The topic of analytical method validation is covered in our courses, ‘Validation, Verification and Transfer of Methods for Pharmaceutical Analysis‘, and ‘Validation, Verification and Transfer of Methods for Biopharmaceutical Analysis‘.
Visit our courses page for a full list of available courses and the schedule of currently available course dates.