
MTS Helpdesk
Question:
ICH Q2(R2) directs that for the results of accuracy and precision, the confidence interval should be compared to the acceptance criteria. How are these confidence intervals calculated?
Answer:
In the 2023 revision of the ICH guideline, Q2(R2): Analytical Procedure Validation, the requirements regarding acceptance criteria for both accuracy and precision studies were updated. Now, instead of comparing a point estimate for the mean recovery in accuracy, and the percent relative standard deviation (or coefficient of variation) in precision, the confidence interval should be calculated and compared to the acceptance criteria. This new requirement means that the calculation of these confidence intervals is now required as part of the data evaluation in analytical procedure validation.
Accuracy
The confidence interval to be calculated relates to the mean percent recovery of the accuracy determinations. The interval represents the range in which the true recovery of the procedure lies with a given degree of confidence, usually 95%. Alternatively, the confidence interval of the bias may be calculated, which is the difference between the actual results obtained and the reference values. It is usually simpler to express bias as a percentage. A narrow confidence interval is desirable for a given level of confidence.
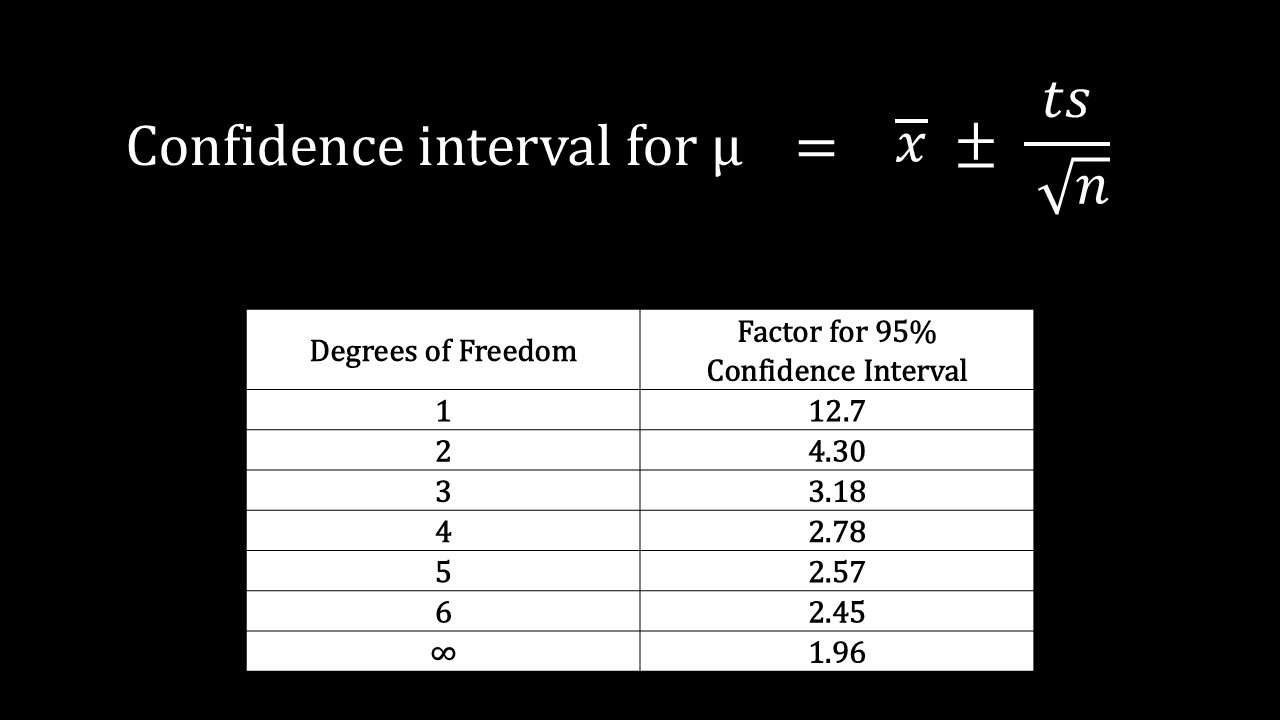
The equation for the confidence interval of the mean percent recovery is as follows:
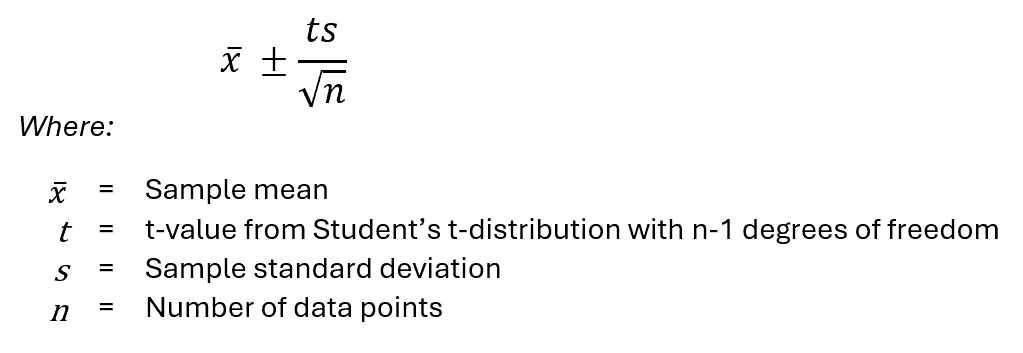
The t-value is obtained from the t-distribution and can be looked up in tables, for example, using the ‘TINV’ function in MS Excel. The value will vary depending on the preferred confidence level and the number of data points and the value will decrease as the number of data points increases. Since the product of the t-value and the sample standard deviation is divided by the square root of the number of data points, a higher number of data points will also result in a smaller confidence interval.
The calculated interval should be compared to the accuracy acceptance criterion, and the study will pass if the full interval is contained within the acceptance criteria. If the mean recovery is within the acceptance criteria but the confidence interval is not, then more data points may be required to reduce the confidence interval and allow a more thorough assessment of the analytical procedure capability.
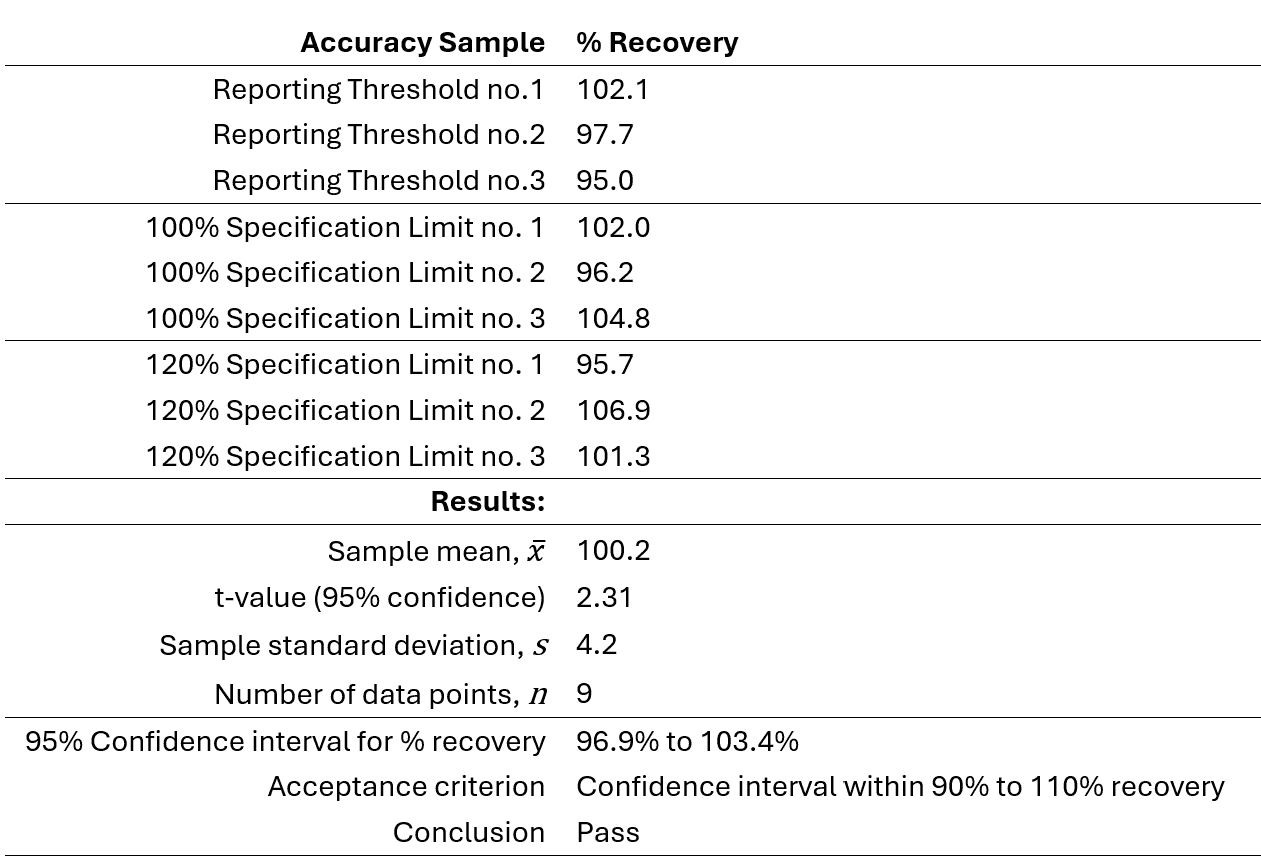
Worked Example:
Accuracy Data Obtained for an Impurity Method
Precision
The confidence interval of the standard deviation should be calculated. Since the acceptance criteria for precision is expressed as a maximum allowed value, the upper confidence limit is compared to the acceptance criterion.
The equation for the upper confidence limit (UCL) of the standard deviation is as follows:
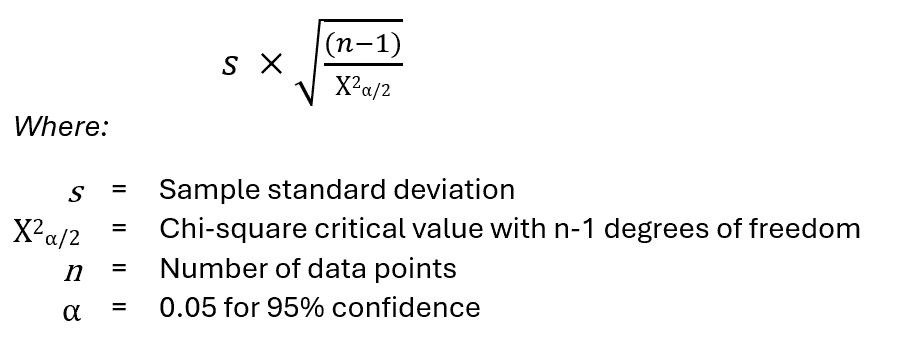
Like the confidence interval of the mean previously discussed, the upper confidence limit of the standard deviation decreases as the number of data points increases. The acceptance criterion for precision is typically expressed in terms of the percentage relative standard deviation, %RSD (or coefficient of variation). Statistically, there are a number of different approaches for the calculation of the UCL for the &RSD. If you are not a statistician, then the simplest approach is to divide the value calculated for the UCL by the sample mean and multiply by 100.
If the point estimate for the %RSD meets the precision acceptance criterion, but the UCL does not, then as was seen previously for accuracy, more data points may be required to reduce the UCL and allow a more thorough assessment of the analytical procedure capability.
Worked Example:
Intermediate Precision Data Obtained for an Impurity Method
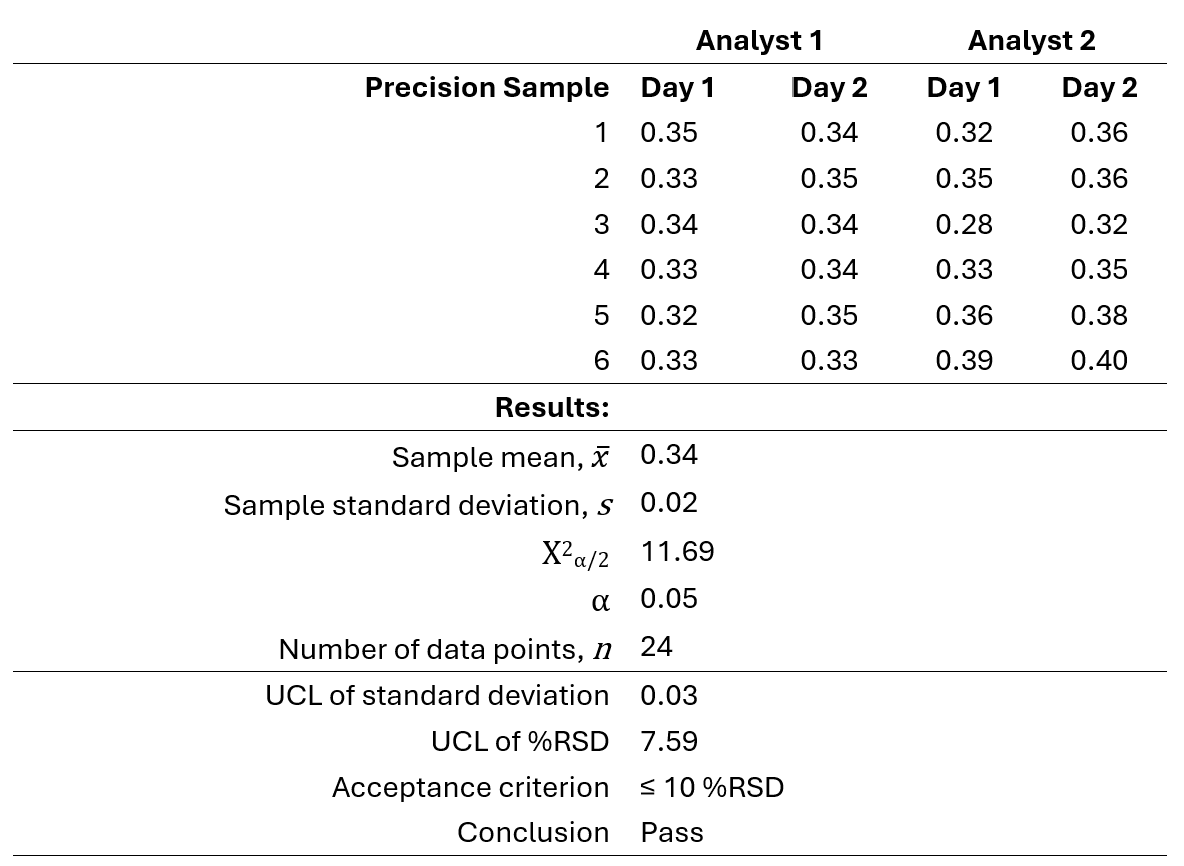
It is noteworthy that the above example is based on a situation where each precision determination is an independent preparation from start to end of the analytical procedure and thus the variability of the individual values in the data set is representative of the procedure in routine use. If a different replication strategy is implemented then the statistics described above may not be suitable, the degrees of freedom may be not be n-1, and a pooled standard deviation may be more appropriate.
Reference
ICH Q2(R2) Validation of Analytical Procedures
Submit a Question to the MTS Helpdesk
Do you have a question for our expert relating to the topic of analytical chemistry? Use our enquiry form to send it to us.
Related content from our Resources Library
Services related to this content that we offer
MTS offers a short course, ‘What’s New in ICH Q2(R2) and Q14?‘, which fully explores the updates to Q2 in terms of the additional information that has been introduced, and the expected benefits, the potential additional validation requirements and associated gap assessment, when compared to previous requirements, and also to provide an overview of the contents of Q14 and how this new guideline relates to Q2(R2).
A full discussion of analytical procedure lifecycle management is included in our courses, ‘Validation, Verification and Transfer of Methods for Pharmaceutical Analysis‘, and ‘Validation, Verification and Transfer of Methods for Biopharmaceutical Analysis‘.
Visit our courses page for a full list of available courses and the schedule of currently available course dates.