
High Performance Liquid Chromatography, or HPLC as it is commonly known, is an important analytical technique used to gain both quantitative and qualitative data for samples produced in a variety of industries such as pharmaceuticals, food products and industrial chemicals. The purpose of this video is to look at the question:
‘What is an HPLC instrument?’
We will focus on analytical applications. The implementation of HPLC requires the use of analytical instrumentation. There are two main reasons for this: The first reason is that sophisticated instruments are needed to create suitable method conditions and the second reason is that reproducible control of these conditions is critical.
An HPLC system can at first glance appear daunting to the new operator. A full understanding of the components common to all HPLCs can transform bewilderment regarding a complicated arrangement of tubing and electronics into an appreciation of a logical and well designed piece of analytical equipment.
The Column
At the heart of all HPLC systems is the column. This is where the separation of the components of interest in your sample actually takes place. It is the interaction of the stationary phase contained in the column, the mobile phase, and the sample components, which forms the basis of this analytical technique.
The stationary phase in your column is typically (but not always) in the form of very small spherical particles. The diameter of these particles is in the order of a few microns, that’s one thousandth of a millimetre. In analytical HPLC the particle size diameter ranges from approximately 1.5 to 10 microns.
To achieve a separation we need to create a flow of mobile phase through the column. To enable this tubing is connected to the ends of the column. The very small size of the particles in the column means that a flow of liquid needs to be pushed through under high pressure to get a reasonable flow rate. As a consequence the tubing needs to be connected in such a way so as to withstand the high pressure. This is achieved by the use of compression fittings. These fittings screw securely into the ends of the column to create a leak-free connection.
The Pump
So far, we have a HPLC column connected by tubing and compression fittings to the mobile phase reservoir. We can add a vessel to collect the waste at the other end of the column. To keep the mobile phase moving through the column at a steady flow rate under high pressure, we need to introduce a pump into the flow path. This instrument is designed to draw the mobile phase from its reservoir and deliver it to the column at the required flow rate.
The Injector
Now we have a flow of mobile phase through our stationary phase but we need a way to introduce the sample for analysis. For this an injector is required. This instrument is designed to inject a small aliquot of sample (typically in the order of a few microlitres) into the flow path of the mobile phase prior to the column. It has to do this without altering or stopping the flow of the mobile phase and thus maintaining the system pressure.
In most modern systems this process is automated and samples are placed in vials which can be injected by the autosampler in the order and amounts programmed by the operator.
The Detector
When the sample has been injected and passes through the column the separated components need to be detected in some way so as to convert the results of the analysis into useful data. The detector is designed to be able to recognise some characteristic of the sample component.
The most common detector is probably an ultra violet detector, or UV. This works by passing a beam of UV light through the flow path of the mobile phase and measuring the absorbance. For those components which absorb UV light the response obtained will be proportional to the amount of the component present. Not all compounds absorb UV light and those that do have different responses so these factors need to be considered when choosing a suitable detector.
There are a range of different detectors available which may be used for HPLC. These include MS, which passes the flow coming out of the column into a mass spectrometer thus obtaining information on the amount and molecular weight of the compound. Other detectors which you may have encountered include: evaporative light scattering, charged aerosol detection, fluorescence and conductivity detection.
The Chromatography Data System (CDS)
Some kind of processor is required to convert the responses from the detector into usable data. Purpose designed software applications called Chromatography Data Systems are available. Common examples are Empower and Chromeleon.
The Mixer
In gradient analysis the composition of the mobile phase is changed during the course of the analysis. To enable this we need another mobile phase reservoir and some way of mixing the two. The mixing may be performed before the pump, in which case it is not yet under pressure and thus is called low pressure mixing. Or, the mixing may be performed after the mobile phase flows through the pump, in which case it is under pressure and thus two pumps will be required.
Systems which use high pressure mixing are often referred to as binary systems since two pumps are needed. In practice low pressure mixing, with a proportioning valve before a single pump, as shown in the video above, is most commonly used.
The Vacuum Degasser
Another instrument which is typically included in a HPLC system is a vacuum degasser since all air needs to be removed from the mobile phase for optimum performance.
The Column Oven
Temperature is an important method parameter which needs to be controlled in HPLC analysis. For this reason the column is often housed in a compartment which can be temperature controlled.
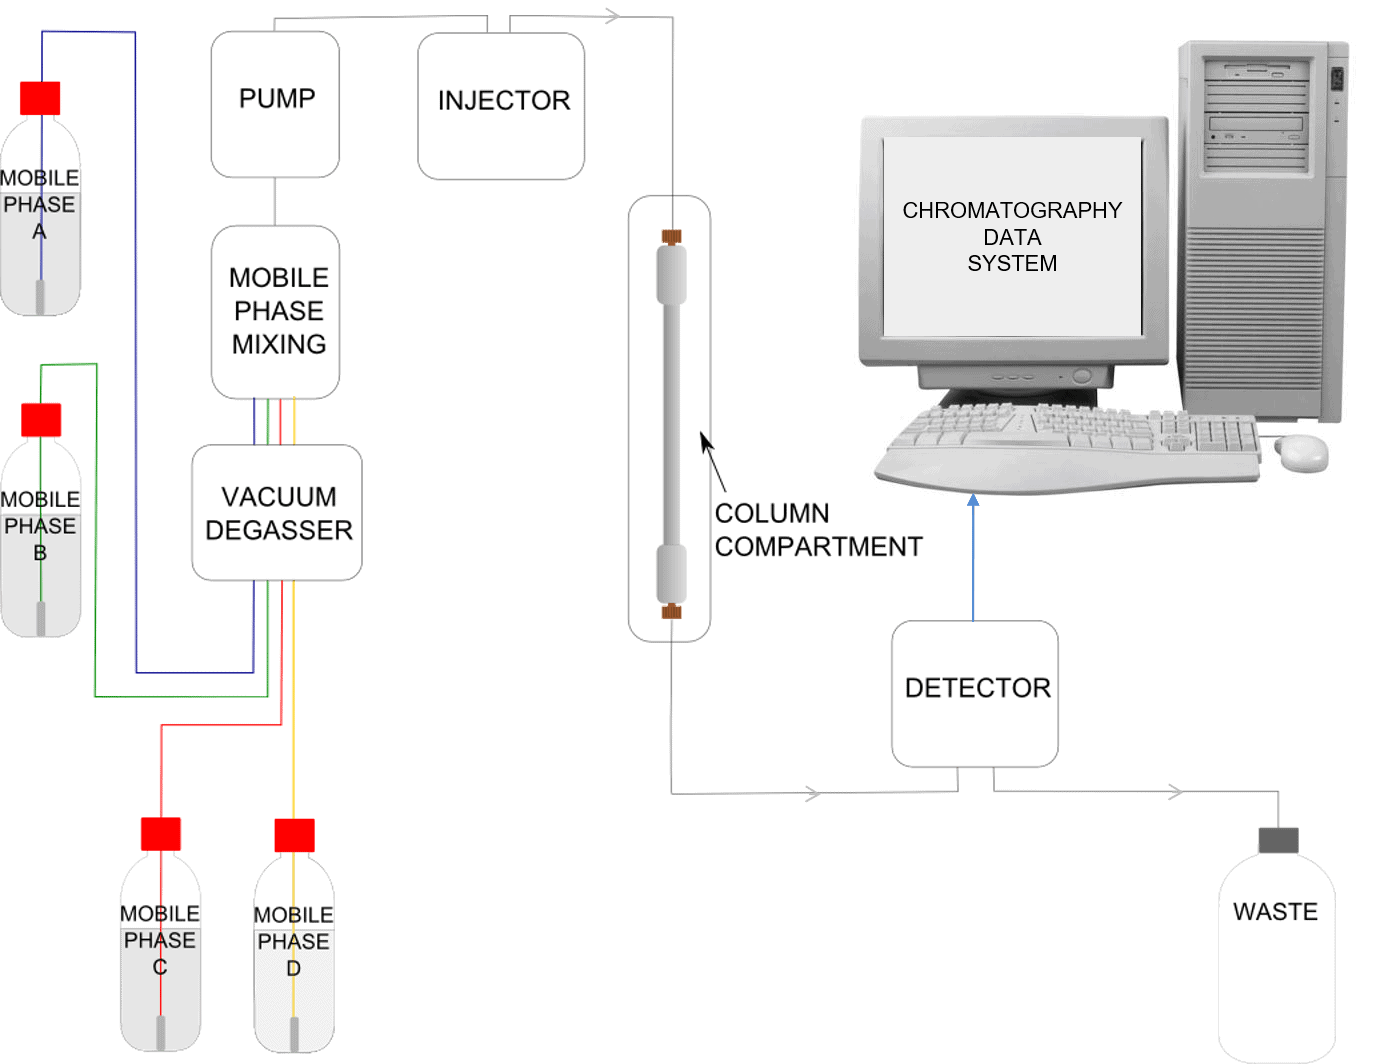
Schematic of an HPLC Instrument
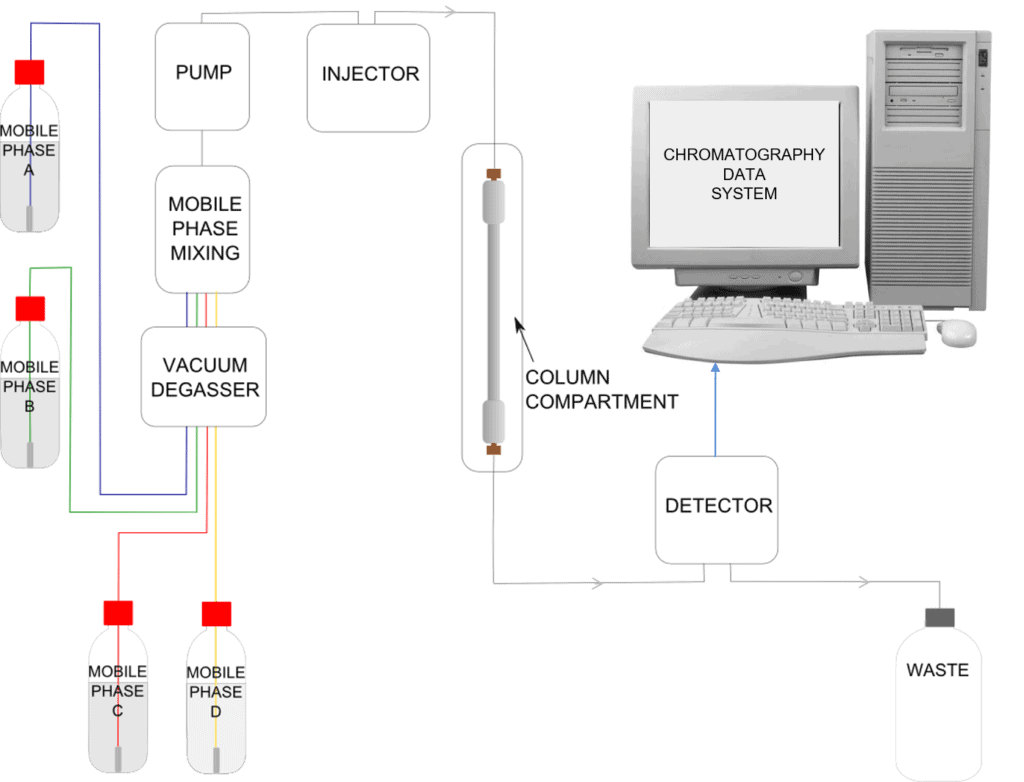
Many available HPLC instruments have the capability to mix mobile phase from four reservoirs, these are known as quaternary systems.
So what happens during an analysis?
The mobile phase is flowing through the system from the mobile phase reservoir to waste. We inject a mixture of 3 components, shown in the video using three colours: pink, green and blue. At the head of the column when the sample first encounters the stationary phase we have a mixture of all three components. The equilibrium between each component, the stationary phase and the mobile phase is different for the three colours in the mixture.
The pink component spends less time in the column relative to the green and the blue. The blue component however spends more time in the column relative to the other two. As the mixture passes through the column they become more and more separated. The pink components leave the column first and on passing through the detector a peak is observed on the processor, then the green component passes through the detector resulting in another peak and finally the blue component passes through and has a corresponding peak.
This plot of the peaks is referred to as a chromatogram. Overall the blue component has spent more time in the column and thus has had more time to spread out. This results in a broader peak relative to a component which has passed through in a quicker time, such as the pink component in this example. It depends on the actual method parameters being used whether this band broadening effect is as noticeable as it is in the example in the video where you can see that the peaks are progressively broader as time passes.
Now that we have looked at the individual components of a typical HPLC instrument you should be able to look at the system that you use in your laboratory, and understand how it works.
Related content from our Resources Library
Services related to this content that we offer
We have a number of training courses on the topic of HPLC, which includes an introductory course, and courses on HPLC method development (including a course specifically aimed at developing stability indicating methods) and HPLC troubleshooting.
Visit our courses page for a full list of available courses and the schedule of currently available course dates.
If you are looking for a book on HPLC, our ‘Introduction to HPLC for Pharmaceutical Analysis‘ by Oona McPolin, may be just what you need.